
: How Many Guns in America, Ownership Data, and Industry Facts 1")
Affiliate disclosure: Some links on this page are affiliate links. If you buy through our links we may receive a small commission at no extra cost to you.
- Treat every gun as loaded
- Point the muzzle in a safe direction
- Keep your finger off the trigger until you’re ready to shoot
- Know your target and what’s beyond
Last updated: June 2026 | Update schedule: Quarterly, with monthly roll-forward when new FBI/ATF data publishes
America by the Numbers: Gun Statistics That Define a Nation
Last updated July 2026 by Nick Hall. We update this page quarterly with current ATF, FBI NICS, and NSSF data.
If you want to cite any statistic on this page, go ahead. We built this as a reference. Every number is sourced, every claim is verifiable, and we update quarterly so the data stays current. Journalists, researchers, students, and curious gun owners: this page is for you.
📊 Free-to-Use Gun Statistics Graphics & Video
We built these gun-statistics visuals so they can travel. Every graphic and clip below is free to republish — on your site, in an article, or on social — as long as you credit USA Gun Shop with a link back to this page. Open Embed or download under any item to grab the code or the file.
🎨 Cartoon graphics
: How Many Guns in America, Ownership Data, and Industry Facts 2")
: How Many Guns in America, Ownership Data, and Industry Facts 3")
: How Many Guns in America, Ownership Data, and Industry Facts 4")
: How Many Guns in America, Ownership Data, and Industry Facts 5")
: How Many Guns in America, Ownership Data, and Industry Facts 6")
: How Many Guns in America, Ownership Data, and Industry Facts 7")
🎬 Animated stat videos
Quotable Gun Statistics: The Quick-Reference List
Need a stat for an article, a presentation, or a social media post? Here are the headline numbers, sourced and ready to cite.
- 506.1 million firearms in civilian possession in the U.S., 1990–2023 (NSSF, 2026)
- 1.5 guns per person or 1.93 per adult in the United States (Small Arms Survey/Census)
- 201 million more guns than registered vehicles in America (ATF/Bureau of Transportation)
- 102 million Americans personally own at least one firearm (Gallup 2025)
- 42% of U.S. households have at least one gun (Gallup 2025)
- 26.2 million first-time gun buyers since 2020 (NSSF 2024)
- Nearly half of new gun buyers are women (NSSF retailer surveys 2020-2024)
- 14.6 million NSSF-adjusted NICS background checks in 2025 (FBI/NSSF)
- 165,183 background checks on Black Friday 2025 alone (FBI NICS)
- $91.7 billion total economic impact of the U.S. firearms industry (NSSF 2025)
- 383,000 jobs supported by the firearms and ammunition industry (NSSF 2025)
- $886 million in Pittman-Robertson excise tax for wildlife conservation (NSSF 2024)
- Montana has the highest ownership rate at 66.3% of adults (2025 surveys)
- 15 million new firearms enter the U.S. civilian market annually (ATF manufacturing + imports)
- Ruger is the #1 U.S. manufacturer with 1.3 million firearms produced in 2023 (ATF)
Table of Contents
How Many Guns Are in America?
The honest answer is nobody knows exactly. The United States doesn’t have a federal firearms registry, which means there’s no government database that tracks every gun in civilian hands. What we have instead are estimates built from manufacturing data, import records, NICS background checks, and survey research. The most widely cited current estimate is approximately 500 million civilian-owned firearms.
The most concrete figure comes from the National Shooting Sports Foundation (NSSF), the firearm industry’s trade association. Using ATF production, import, and export data, NSSF puts the total at 506.1 million firearms in civilian possession from 1990 through 2023 (2025 Edition, released January 2026). That figure counts every gun added to the civilian market since 1990, domestic production plus imports, minus exports. It does not subtract for firearms later lost, destroyed, or worn out, and it excludes anything made before 1990. Estimates that adjust for attrition, like RAND’s, put the number still in circulation today closer to 400 million. Both are defensible; they measure different things. The pandemic buying surge from 2020 to 2022 added an estimated 60 million firearms in three years, accelerating the climb.
To put 500 million in perspective: that’s 1.5 firearms for every person in the country, or roughly 1.93 firearms per adult. The United States has more civilian-owned guns than any other country on Earth, by a massive margin. The next closest is India with an estimated 71 million, and they have four times our population.
Guns Through the Decades: How America Armed Up
The 500 million figure didn’t happen overnight. The American civilian arsenal has more than doubled in a single generation. Here’s the climb, built from the best estimate available at each point in time.
Sources: National Institute of Justice survey (1994), Congressional Research Service “Gun Control Legislation” (2009), Small Arms Survey (2017), NSSF Firearm Production report, 2025 Edition (2026, firearms in civilian possession 1990–2023). Each estimate uses a different method, so treat the trajectory as directional.
Two surges drove the climb. The first ran through the 2000s as the modern sporting rifle went mainstream. The second was the pandemic spike from 2020 to 2022, which added an estimated 60 million firearms in three years. The arsenal grew by more than 200 million guns in roughly three decades, faster than the U.S. population grew over the same period.
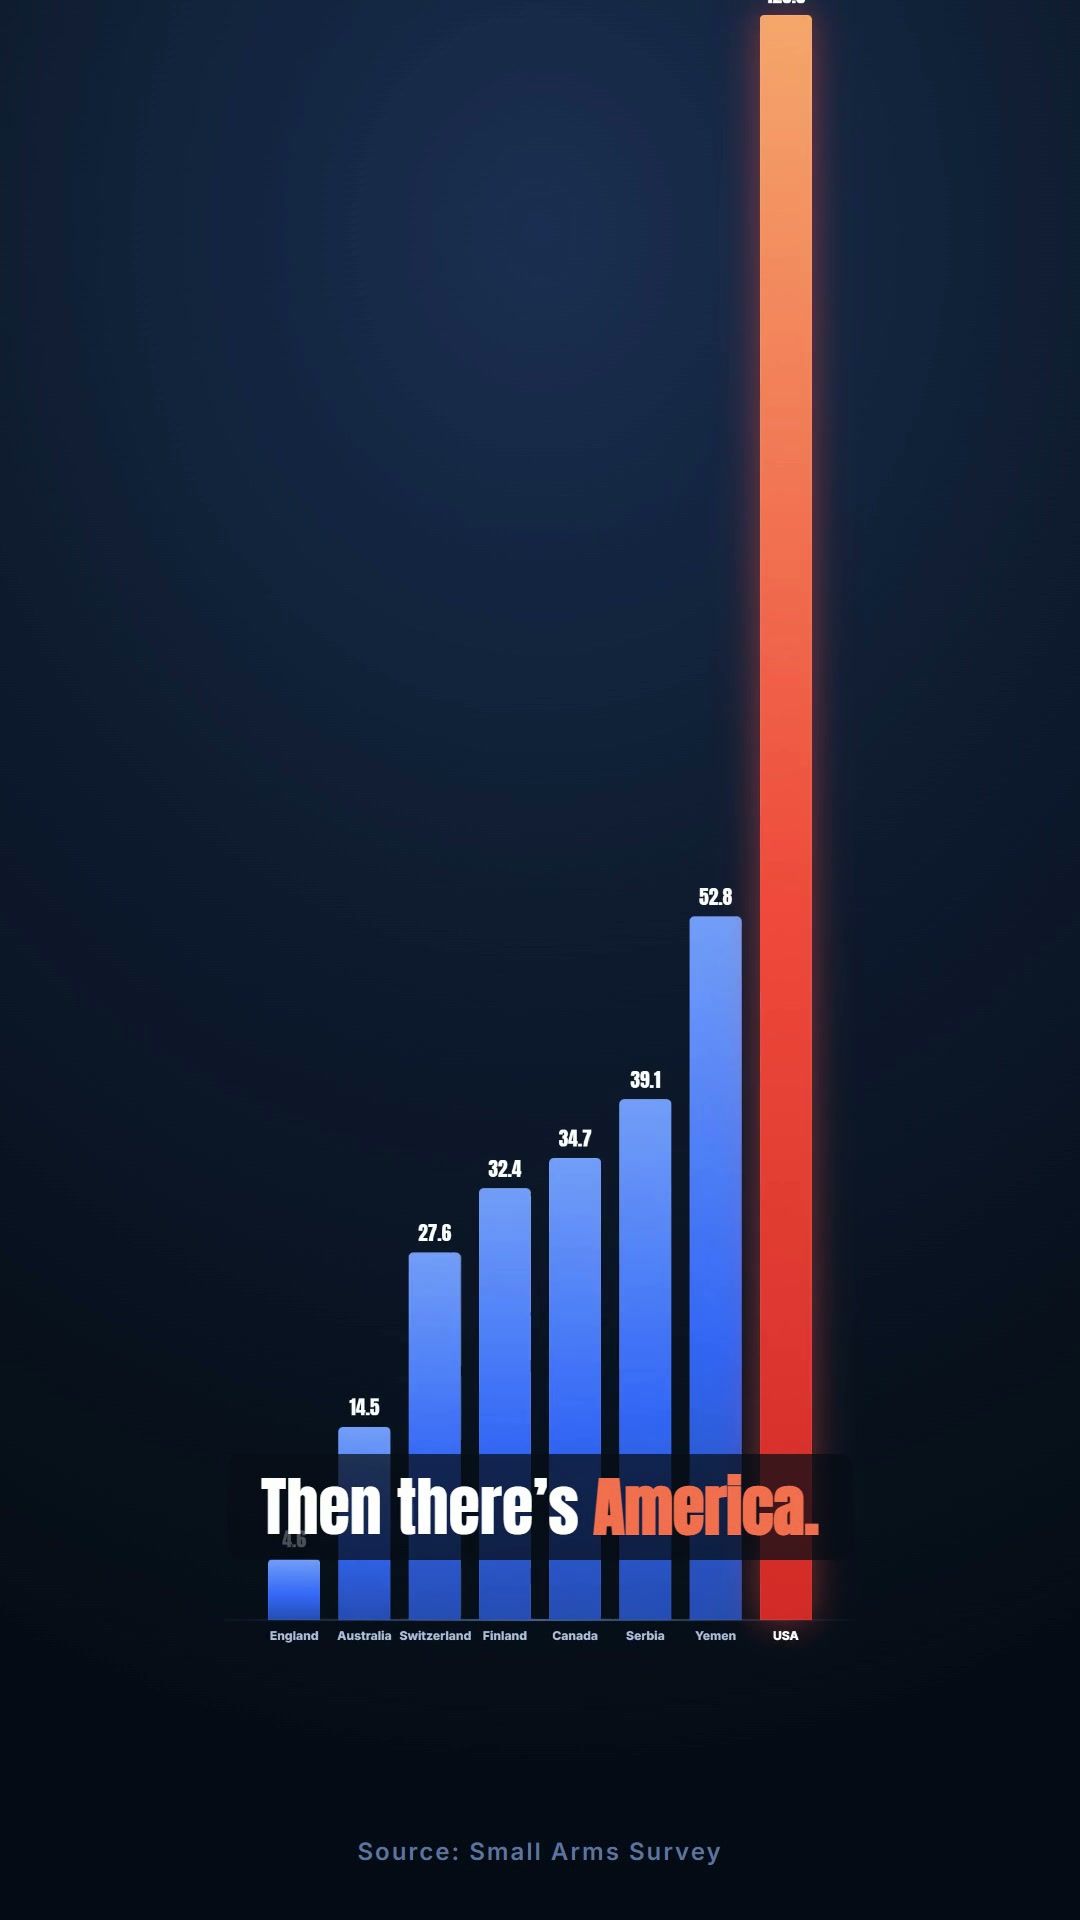
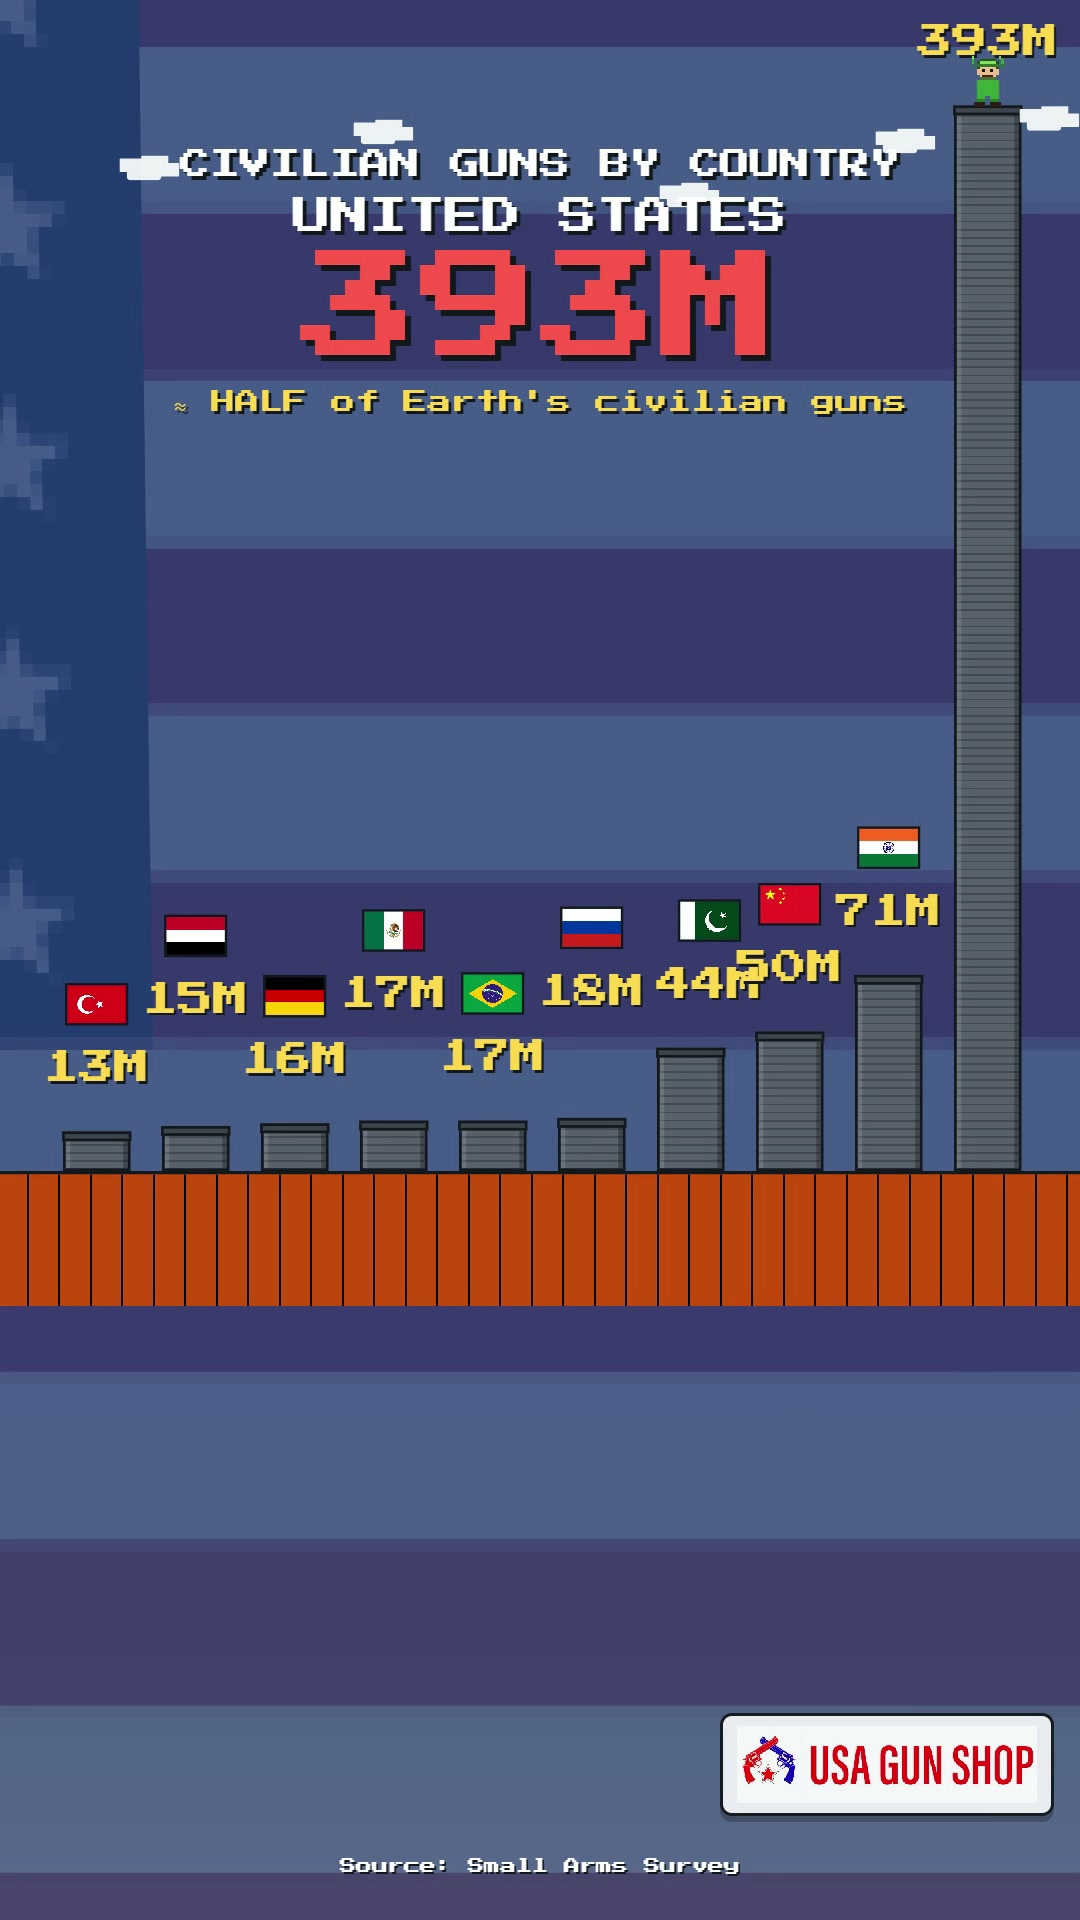
America vs. the World: The Global Gun Gap
Here is the single most-quoted gun statistic on Earth, and it holds up. The United States has about 4% of the world’s people but roughly 46% of the world’s civilian-owned firearms. No other country is remotely close.
| Rank | Country | Civilian-Owned Firearms |
|---|---|---|
| 1 | United States | ~393,300,000 |
| 2 | India | ~71,100,000 |
| 3 | China | ~49,700,000 |
| 4 | Pakistan | ~43,900,000 |
| 5 | Russia | ~17,600,000 |
| 6 | Brazil | ~17,500,000 |
Source: Small Arms Survey, “Estimating Global Civilian-held Firearms Numbers” (2018, using 2017 data). U.S. total dwarfs every other nation.
The per-capita gap is just as stark. The United States has about 120 guns for every 100 residents, the only country on Earth with more guns than people. The next-closest nation, Yemen, sits at roughly 53 per 100. American civilians own more firearms than the civilians of the next 25 countries combined, and more than every one of the world’s militaries put together. For how that arsenal breaks down at home, see our US gun laws by state directory.
Guns vs. Everything Else: Comparisons That Put It in Perspective
Numbers this large are hard to grasp in isolation. Here’s how America’s gun count stacks up against other things we count.
| What We’re Counting | Total | Source |
|---|---|---|
| Civilian-owned firearms | ~500,000,000 | NSSF, 2026 |
| Registered motor vehicles | 298,700,000 | Bureau of Transportation |
| Dogs (pets) | 89,700,000 | APPA 2024 |
| Cats (pets) | 74,100,000 | APPA 2024 |
| Cattle (livestock) | 87,200,000 | USDA 2024 |
| Households | 132,800,000 | U.S. Census 2025 |
| Total U.S. population | 341,000,000 | U.S. Census 2025 |
Read that first comparison again. There are 201 million more guns in America than registered cars. There are about 7 guns for every dog. There are almost 4 guns per household. These numbers are unique in the world and they explain why the American firearms market, culture, and political landscape look the way they do.
Who Owns Guns in America? Demographics and Trends
Gun ownership in America is broader, more diverse, and less monolithic than either side of the political aisle wants to admit. Here’s what the survey data actually shows.
| Demographic | Gun Ownership Rate | Context |
|---|---|---|
| All U.S. adults | 30-32% | ~102 million personal gun owners |
| Households with a gun | 42% | 55.8 million households |
| Men | 40% | Traditionally the dominant demographic |
| Women | 25% | Fastest-growing ownership demographic |
| Rural residents | 47% | Nearly half of rural adults own firearms |
| Suburban residents | 30% | Tracks with national average |
| Urban residents | 20% | Lower but growing, especially post-2020 |
| Republican/lean Republican | 45% | 2.25x higher than Democrats |
| Democrat/lean Democrat | 20% | 1 in 5 Democrats owns a gun |
Sources: Gallup 2025, Pew Research Center 2024
The biggest story in gun ownership demographics isn’t any single number. It’s the trend. 26.2 million Americans became first-time gun owners between 2020 and 2024. That’s roughly the population of Texas becoming new gun owners in four years. And the composition of that group broke every stereotype: nearly half were women, African American women were the fastest-growing demographic, and urban buyers represented a larger share than in any previous period.
Gun Ownership by Race and Ethnicity (2025)
| Group | Adults Owning | Growth vs 2019 |
|---|---|---|
| White (non-Hispanic) | 36% | +8% |
| Black or African American | 24% | +58% (first-time buyers 2020 vs 2019) |
| Hispanic or Latino | 21% | +49% (first-time buyers 2020 vs 2019) |
| Asian American | 14% | +43% (first-time buyers 2020 vs 2019) |
| Other/Multiracial | 28% | +18% |
Sources: Pew Research Center 2024, NSSF Retailer Surveys 2020-2024. Growth columns reflect first-time-buyer surge in 2020-2024 versus 2019 baseline. Black women specifically were the fastest-growing demographic of new gun owners during this period.
The race and ethnicity data shows the single biggest demographic story of the 2020s gun market. Black women became the fastest-growing demographic of first-time gun buyers during the pandemic, driven by personal safety concerns and a shift in cultural attitudes toward firearms ownership in Black communities. The NSSF retailer survey data is corroborated by Pew Research’s 2024 findings, which show African American adults reporting personal firearm ownership at 24%, up from approximately 16% pre-pandemic.
The pandemic, civil unrest, and rising crime rates in 2020-2021 drove millions of people who had never considered gun ownership to buy their first firearm. Many of those buyers have stayed. The gun-owning community in 2026 is the most diverse it has ever been, and that shift is reshaping the industry, the politics, and the culture around firearms in ways that are just starting to play out.
The Super-Owners: Who Actually Owns 500 Million Guns
Here’s the twist in the ownership data. Those 500 million guns are not spread evenly across the roughly 102 million Americans who own one. They’re concentrated. The landmark 2015 Harvard-Northeastern survey found that about 3% of American adults own roughly half of all the civilian guns in the country.
These “super-owners” average about 17 firearms each, with some collections running into the dozens or hundreds. The typical gun-owning household, by contrast, keeps around five. So the average hides two very different realities: a large majority of owners with a handful of guns, and a small, deeply committed minority holding the bulk of the arsenal. It’s the same pattern you see in plenty of hobbies, just with much higher stakes attached.
Gun Ownership by State: Where America Is Most Armed
Gun ownership varies wildly by state. The gap between the most and least armed states is enormous, driven by a mix of culture, geography, regulation, and urban-vs-rural population balance.
Highest Ownership Rates
| 1. Montana | 66.3% |
| 2. Wyoming | 66.2% |
| 3. Alaska | 64.5% |
| 4. Idaho | 60.1% |
| 5. West Virginia | 58.5% |
Lowest Ownership Rates
| 46. New York | 19.9% |
| 47. Hawaii | 14.9% |
| 48. Rhode Island | 14.8% |
| 49. Massachusetts | 14.7% |
| 50. New Jersey | 14.7% |
Full State-by-State Gun Ownership (All 50 States + DC)
| Rank | State | Adults Owning | Rank | State | Adults Owning |
|---|---|---|---|---|---|
| 1 | Montana | 66.3% | 26 | North Carolina | 38.8% |
| 2 | Wyoming | 66.2% | 27 | Indiana | 37.5% |
| 3 | Alaska | 64.5% | 28 | Vermont | 37.0% |
| 4 | Idaho | 60.1% | 29 | Texas | 36.5% |
| 5 | West Virginia | 58.5% | 30 | Pennsylvania | 35.5% |
| 6 | Arkansas | 57.9% | 31 | Wisconsin | 34.7% |
| 7 | South Dakota | 57.6% | 32 | Michigan | 32.4% |
| 8 | North Dakota | 55.1% | 33 | Iowa | 32.4% |
| 9 | Alabama | 55.5% | 34 | Nebraska | 32.0% |
| 10 | Mississippi | 55.8% | 35 | Washington | 28.0% |
| 11 | Louisiana | 52.5% | 36 | Minnesota | 27.5% |
| 12 | Oklahoma | 52.7% | 37 | Virginia | 27.0% |
| 13 | Tennessee | 52.5% | 38 | Maine | 26.9% |
| 14 | Kentucky | 47.7% | 39 | Colorado | 25.2% |
| 15 | Missouri | 47.9% | 40 | Florida | 25.0% |
| 16 | Utah | 46.4% | 41 | Maryland | 23.9% |
| 17 | South Carolina | 44.4% | 42 | Illinois | 23.0% |
| 18 | Kansas | 43.4% | 43 | Delaware | 22.7% |
| 19 | Georgia | 42.1% | 44 | Connecticut | 22.6% |
| 20 | Nevada | 41.0% | 45 | California | 20.1% |
| 21 | Arizona | 40.7% | 46 | New York | 19.9% |
| 22 | New Hampshire | 40.4% | 47 | Hawaii | 14.9% |
| 23 | New Mexico | 40.4% | 48 | Rhode Island | 14.8% |
| 24 | Oregon | 39.8% | 49 | Massachusetts | 14.7% |
| 25 | Ohio | 39.3% | 50 | New Jersey | 14.7% |
Sources: RAND State-Level Estimates of Household Firearm Ownership (latest available, extrapolated to 2025), CBS News 2024 ownership map, state-level NICS aggregates. State-level estimates carry ±5 percentage point uncertainty given the absence of a national registry.
The state-by-state spread is the widest of any developed-country gun ownership pattern globally. Montana adults own firearms at 4.5x the rate of New Jersey adults. The top 10 states are clustered in the Mountain West, Appalachia, and the Deep South. The bottom 10 are concentrated in the Northeast Corridor and Hawaii. Population density correlates inversely with ownership: rural states dominate the top of the list, dense urban states the bottom.
The pattern is clear: western and rural states lead, northeastern urban states trail. Montana and Wyoming each have roughly two-thirds of adults owning firearms, while New Jersey and Massachusetts sit at less than 15%. That 4.5x gap between the top and bottom reflects deeply different relationships with firearms shaped by geography, culture, and regulatory environments. For state-specific gun law details, see our US gun laws by state directory.
Concealed Carry by the Numbers
As of 2024, roughly 21.5 million Americans held an active concealed-carry permit, about 8.2% of all adults, according to the Crime Prevention Research Center. That figure has multiplied many times over since the early 2000s, when fewer than 5 million permits were on the books.
But the permit count badly undercounts how many people actually carry, because 29 states are now permitless “constitutional carry” states where no permit is required at all. Residents of Texas, Florida, and 27 others can carry concealed without ever applying, so they never show up in the permit totals. The real number of Americans who carry is well north of the official 21.5 million. To see what your state requires, check our state-by-state gun law directory, and if you’re choosing a carry gun, our best concealed carry handguns guide is a solid place to start.
FBI NICS Background Checks: The Demand Pulse
FBI NICS (National Instant Criminal Background Check System) data is the closest thing we have to a real-time demand indicator for the firearms market. It’s not a perfect gun sales counter because some states use NICS for permit checks and other non-sale purposes. But as a directional trend indicator, it’s the best publicly available dataset.
| Year | NSSF-Adjusted NICS Checks | Year-over-Year Change |
|---|---|---|
| 2025 | 14,612,314 | -4.1% |
| 2024 | 15,239,011 | -1.7% |
| 2023 | 15,504,005 | -3.9% |
| 2022 | 16,441,483 | -7.5% |
| 2021 | 18,499,802 | -10.8% |
| 2020 (Record Year) | 21,083,643 | +40.2% |
| 2019 | 13,199,172 | Baseline |
Source: NSSF-adjusted NICS figures exclude permit checks and re-checks. Raw FBI totals are higher.
The story is clear: 2020 was a seismic event. The pandemic, social unrest, and election anxiety drove a 40% surge in background checks. The market has been gradually normalizing since then, but 2025’s 14.6 million adjusted checks is still roughly 10% higher than the pre-pandemic baseline. The gun market didn’t go back to normal. It settled at a new, higher normal.
Black Friday remains the single busiest day for NICS. In 2025, the system processed 165,183 checks on Black Friday alone, with 530,156 for the entire Thanksgiving week. If you’ve ever wondered why gun deals in November are so aggressive, that’s your answer. Our gun deals page tracks the best prices across 200+ retailers in real time.
The Gun Industry: An Economic Powerhouse
The firearms industry isn’t just a cultural force. It’s an economic one. The NSSF’s 2025 Economic Impact Report puts the total economic impact at $91.7 billion, up from $19.1 billion in 2008. That’s a 379% increase in 16 years.
| Metric | 2024 Figure |
|---|---|
| Total economic impact | $91.7 billion |
| Direct industry jobs | 150,668 |
| Total jobs (including suppliers/ancillary) | 382,995 |
| Average salary + benefits | $68,300 |
| Total taxes paid annually | $10.97 billion |
| Pittman-Robertson excise tax (wildlife conservation) | $886 million |
Source: NSSF 2025 Firearm and Ammunition Industry Economic Impact Report
That last line is worth pausing on. The firearms industry contributes $886 million annually to wildlife conservation through Pittman-Robertson excise taxes. This fund, which taxes firearms and ammunition at the manufacturer level, has been the single largest source of wildlife habitat restoration funding in the United States since 1937. Hunters and gun owners have contributed over $16 billion to conservation through this mechanism. Whether you shoot or not, American wildlife management is fundamentally funded by the gun industry.
More Gun Dealers Than McDonald’s, Starbucks, and Walmart Combined
The retail footprint of the gun business is bigger than most people realize. The ATF counted about 128,690 active Federal Firearms Licenses in 2024, and roughly 52,000 of those are Type 01 dealers, the licenses that let a storefront sell guns to the public. Put that next to America’s most familiar chains and the scale lands.
Sources: ATF Federal Firearms and Explosives Licenses by Type (2024); company store counts (2024-2025). Type 01 dealers are about 40% of all FFLs.
Add it up: roughly 52,000 licensed gun dealers versus about 13,600 McDonald’s, 15,300 Starbucks, and 4,600 Walmart stores. There are more places to legally buy a gun in America than there are McDonald’s, Starbucks, and Walmart locations combined. If you’d rather shop the best of them online, our best online gun stores guide ranks the top retailers.
U.S. Firearms Manufacturing and Imports
The supply side of the equation tells its own story. American manufacturers produced nearly 13.8 million firearms in 2021 (the post-pandemic peak), dropping to 9.8 million by 2023 as demand normalized. Pistols dominate domestic production, followed by rifles and shotguns.
Ruger has been the #1 U.S. manufacturer for seven of the last ten years, producing 1.3 million firearms in 2023 alone. Smith & Wesson, Sig Sauer, and Springfield Armory round out the major domestic producers.
Top 10 US Firearm Manufacturers (2023 Production, Latest ATF AFMER)
| Rank | Manufacturer | Annual Production | Headquarters |
|---|---|---|---|
| 1 | Sturm, Ruger & Co. | ~1.3 million | Mayodan, NC |
| 2 | Smith & Wesson | ~1.1 million | Maryville, TN |
| 3 | Sig Sauer (Sig Arms) | ~900,000 | Newington, NH |
| 4 | Springfield Armory | ~750,000 | Geneseo, IL |
| 5 | Palmetto State Armory | ~600,000 | Columbia, SC |
| 6 | Mossberg & Sons | ~580,000 | North Haven, CT |
| 7 | Henry Repeating Arms | ~450,000 | Bayonne, NJ |
| 8 | Remington Firearms (RemArms) | ~400,000 | Ilion, NY / LaGrange, GA |
| 9 | Beretta USA | ~350,000 | Gallatin, TN |
| 10 | Kel-Tec CNC | ~280,000 | Cocoa, FL |
Source: ATF AFMER 2023 (released 2025). AFMER data publishes with a one-year lag under the Trade Secrets Act. Production figures are approximate and exclude prototype, military, and law-enforcement-only runs.
Imports add another 5-6 million firearms per year. The top source countries are Turkey (2.75 million across 2023-2024, primarily shotguns), Austria (2.15 million, primarily Glock pistols), and Brazil (1.76 million, primarily Taurus handguns). Total imports were 5.4 million in 2024, down 7.4% from 2023.
Combined, domestic manufacturing and imports put roughly 15 million new firearms into the American market every year. That’s 41,000 new guns per day entering civilian circulation. The number that leave (through loss, seizure, destruction, or export) is far smaller, which is how the total civilian count keeps climbing even as annual sales moderate.
How Many AR-15s Are in America?
The AR-15 and its cousins, what the industry calls modern sporting rifles, are the most politically charged guns in the country and also among the most common. The NSSF estimates there are now about 32 million modern sporting rifles in civilian circulation, up from 24.4 million just a few years earlier. That figure counts AR-pattern and AK-pattern rifles produced or imported since 1990.
To put 32 million in perspective, that’s more AR-style rifles in American safes and closets than there are people in Texas. The rifle that gets called a “weapon of war” in political debates is, by the numbers, one of the best-selling sporting rifles in American history. If you’re shopping for one, our best websites to buy an AR-15 online guide covers where to look, and our rifle deals track current pricing.
The NFA World: Suppressors, Silencers, and Machine Guns
Beyond ordinary rifles and pistols sits the world of the National Firearms Act, the 1934 law that regulates suppressors, short-barreled rifles, machine guns, and a few other categories. These items require federal registration, a tax stamp, and a months-long approval, and the registry numbers tell a fascinating story, especially for suppressors.
| NFA Item | Registered | As Of |
|---|---|---|
| Suppressors (silencers) | ~4,857,898 | 2024 |
| Destructive devices | ~2,709,704 | 2016 |
| Machine guns | ~630,019 | 2016 |
| Short-barreled rifles (SBRs) | ~297,626 | 2016 |
| Short-barreled shotguns (SBSs) | ~146,098 | 2016 |
| Any Other Weapons (AOWs) | ~60,019 | 2016 |
Sources: ATF Firearms Commerce Report (per-category figures, 2016 = last official breakdown) and ATF FOIA suppressor data (2024). ATF stopped publishing the full category table after 2017, so the suppressor count is current while the others are the last official counts and are higher today.
The headline is the suppressor boom. Registered suppressors nearly doubled in three years to almost 4.9 million, roughly one for every 70 Americans, and they now make up around 80% of all NFA transfers, driven by hearing-protection awareness and faster electronic approvals. The machine gun number, by contrast, is effectively frozen. The 1986 Hughes Amendment closed the registry to new civilian machine guns, so the roughly 630,000 transferable ones are all there will ever be, which is why a transferable full-auto can sell for five or six figures.
The New Gun Owner: 26.2 Million and Counting
If there’s one statistic that defines the 2020s in firearms, it’s this: 26.2 million Americans bought their first gun between 2020 and 2024. To put that in context, that’s roughly the entire population of Texas becoming new gun owners in four years.
The demographics of these new buyers shattered stereotypes. Nearly half were women. African American women were the fastest-growing demographic of first-time gun buyers. Urban buyers represented a larger share than in any previous era. The new gun owner in 2026 is as likely to be a suburban mom in Atlanta as a rancher in Montana, and the industry is still adapting to serve both.
Self-defense is the primary motivation for the vast majority of new buyers, driven by pandemic-era uncertainty, high-profile civil unrest, and the realization that personal safety is ultimately a personal responsibility. Many of these new owners have since invested in training, holsters, safes, and carry permits. They’re not casual buyers. They’re building a relationship with firearms that their parents’ generation may never have had.
If you’re one of those 26 million and you’re still figuring out what you need, our concealed carry guide and best concealed carry handguns list are good starting points.
Live Market Snapshot
We track prices across 80+ online firearms retailers in real time. Here’s what the most popular categories are selling for right now.
Top-Selling Handguns Right Now
Best-priced firearms across 200+ retailers · Updated every 4 hours
: How Many Guns in America, Ownership Data, and Industry Facts 8")
: How Many Guns in America, Ownership Data, and Industry Facts 9")
: How Many Guns in America, Ownership Data, and Industry Facts 10")
: How Many Guns in America, Ownership Data, and Industry Facts 11")
: How Many Guns in America, Ownership Data, and Industry Facts 12")
: How Many Guns in America, Ownership Data, and Industry Facts 13")
: How Many Guns in America, Ownership Data, and Industry Facts 14")
: How Many Guns in America, Ownership Data, and Industry Facts 15")
: How Many Guns in America, Ownership Data, and Industry Facts 16")
: How Many Guns in America, Ownership Data, and Industry Facts 17")
: How Many Guns in America, Ownership Data, and Industry Facts 18")
: How Many Guns in America, Ownership Data, and Industry Facts 19")
Top-Selling Rifles Right Now
Best-priced firearms across 200+ retailers · Updated every 4 hours
: How Many Guns in America, Ownership Data, and Industry Facts 20")
: How Many Guns in America, Ownership Data, and Industry Facts 21")
: How Many Guns in America, Ownership Data, and Industry Facts 22")
: How Many Guns in America, Ownership Data, and Industry Facts 23")
: How Many Guns in America, Ownership Data, and Industry Facts 24")
: How Many Guns in America, Ownership Data, and Industry Facts 26")
: How Many Guns in America, Ownership Data, and Industry Facts 27")
: How Many Guns in America, Ownership Data, and Industry Facts 28")
: How Many Guns in America, Ownership Data, and Industry Facts 29")
: How Many Guns in America, Ownership Data, and Industry Facts 30")
: How Many Guns in America, Ownership Data, and Industry Facts 31")
For a deeper look at current deals, check our daily gun deals page and price comparison tool that searches 200+ retailers simultaneously.
Surprising Gun Stats: Quirky Facts Worth Quoting
A few more numbers that stop people mid-scroll. Every one is sourced above or in the methodology section below.
Methodology and Sources
Every number on this page comes from a verifiable source. Here’s what we use and why.
- FBI NICS monthly and annual background check data. We use NSSF-adjusted figures that exclude permit checks and re-checks for a more accurate proxy of actual firearm sales.
- ATF Firearms Commerce Reports for domestic manufacturing, import/export data, and FFL counts by state.
- NSSF Economic Impact Reports for industry employment, tax revenue, and total economic impact figures.
- Pew Research Center and Gallup for survey-based ownership rates, demographics, and household data.
- Small Arms Survey for the baseline civilian firearms estimate that we build on with annual manufacturing and import data.
- U.S. Census Bureau for population data used in per-capita calculations.
We update this page quarterly when new FBI and ATF data files publish. The “last updated” timestamp at the top tells you exactly when the most recent refresh happened. If you spot an error or know of a better source for any figure, email us at contact@usa-gun-shop.com.
FAQ: US Gun Statistics
For current ammunition pricing across every major caliber, see our Ammo Price Index.
For a state-by-state look at where the gun stores actually are, see our map of The Most Armed-to-the-Teeth States.
How many guns are in America?
An estimated 500 million civilian-owned firearms are in the United States as of 2026. That works out to approximately 1.5 guns per person or 1.93 per adult. This estimate is built from the Small Arms Survey baseline, annual ATF manufacturing data, and import records.
Are there more guns than people in the US?
Yes. With approximately 500 million firearms and a population of 341 million, the US has roughly 1.5 guns per person. There are also 201 million more guns than registered motor vehicles (299 million).
What percentage of Americans own guns?
Approximately 30-32% of American adults personally own at least one firearm (about 102 million people). When including household members who live with a gun owner, 42% of US households have at least one firearm.
Which state has the highest gun ownership rate?
Montana leads with 66.3% of adults owning firearms, followed by Wyoming (66.2%) and Alaska (64.5%). The lowest rates are in Massachusetts and New Jersey at 14.7%.
How many background checks does the FBI process per year?
In 2025, the NSSF-adjusted NICS figure was 14,612,314 background checks, averaging about 40,000 checks per day. The record year was 2020 with over 21 million adjusted checks.
How many new gun owners have there been since 2020?
26.2 million Americans became first-time gun owners between 2020 and 2024, according to NSSF retailer surveys. Nearly half were women, and African American women were the fastest-growing demographic of new buyers.
How much is the US gun industry worth?
The total economic impact of the US firearms and ammunition industry was $91.7 billion in 2024, supporting 383,000 jobs and generating $10.97 billion in annual tax revenue. The industry has grown 379% since 2008.
How many guns are manufactured in the US each year?
US manufacturers produced approximately 9.8 million firearms in 2023, down from a peak of 13.8 million in 2021. Combined with 5.4 million imports, roughly 15 million new firearms enter the civilian market each year.
10,593+ Gun & Ammo Deals
Updated daily from 200+ top retailers. Filter by category, caliber, action type, and price.