

Last updated October 2026 · By Nick Hall, who watches gun prices every day because it’s the job
Some of the links below are affiliate links, meaning at no additional cost to you, we may earn a commission if you click through and make a purchase.
Quick Answer: Gun prices went nowhere this fall. Our US Gun Price Index tracked 43,503 new-gun listings at the same retailers every week from July 25 to October 22, 2026, and it ended at 99.67, down 0.33%. Two out of three listings never changed price at all. Rifles slipped the most, and Ruger’s revolvers were the one clear price rise.
Consumer prices rose 0.91% over roughly the same stretch, so in real money a new gun got about 1% cheaper.
Table of Contents
How we tested: Every pick here is ranked against our testing methodology. Minimum round counts, accuracy and reliability protocols, the failures that disqualify a gun.
The US Gun Price Index, Fall 2026
We track prices from the biggest gun retailers in the country every day for our gun price check. That gives us something nobody else in this search result has: the same gun, at the same store, priced every week. So instead of guessing whether gun prices are going up or down, I measured it.
The index follows 43,503 new-gun listings that were priced in the first week of the quarter and again in the last. The week of July 25 is set to 100. A reading of 99 means the same guns cost 1% less.
| Measure | Fall 2026 |
|---|---|
| Index, week of July 25 | 100.00 |
| Index, week of October 17 | 99.67 |
| Lowest week | 99.53, week of September 12 |
| Listings tracked | 43,503 |
| Listings that never changed price | 65.6% |
| Listings with a lower price | 18.5% |
| Listings with a higher price | 15.9% |
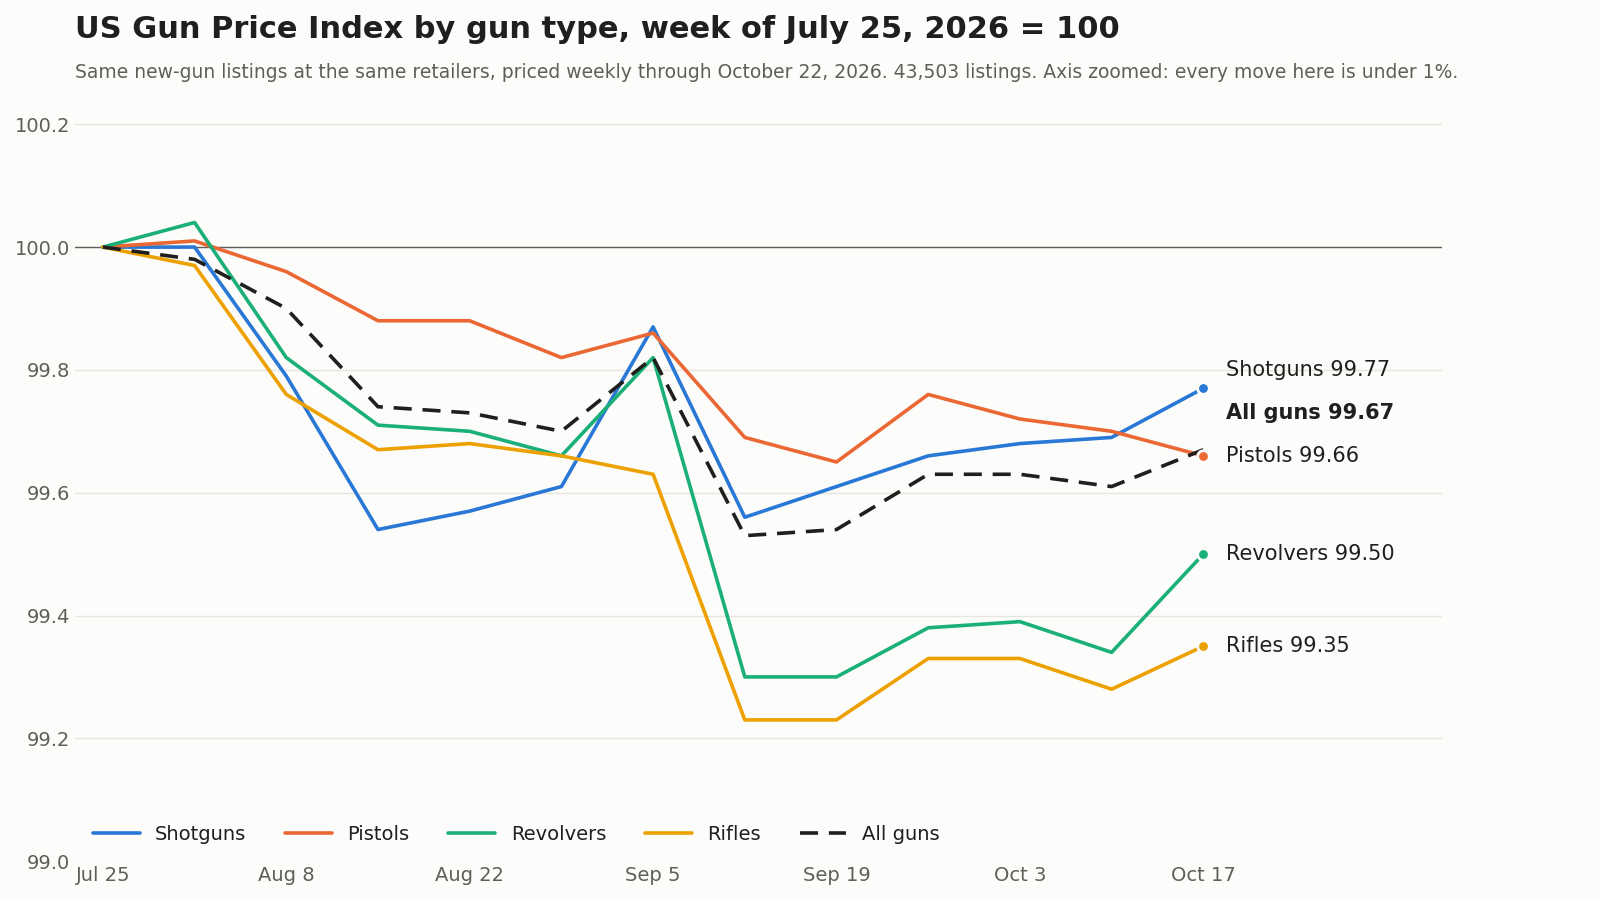
Look at the scale on that chart before you read too much into the lines. The whole thing runs from 99 to just over 100. The biggest move of any gun type was a dip of under 1%, and every line spent the quarter within a hair of where it started.
Gun Prices by Type
I sorted every listing I could into pistols, revolvers, rifles and shotguns by its product name. That covered 26,521 of the 43,503. The rest had names too vague to sort, and they still count in the overall index.
| Gun type | Listings | Index, Oct 17 | Lowest week | Price cut | Price raised |
|---|---|---|---|---|---|
| Shotguns | 5,311 | 99.77 | 99.54 | 18.2% | 13.4% |
| Pistols | 7,655 | 99.66 | 99.65 | 14.4% | 11.0% |
| Revolvers | 2,401 | 99.50 | 99.30 | 21.7% | 14.2% |
| Rifles | 11,154 | 99.35 | 99.23 | 15.4% | 9.4% |
Rifles did the most slipping. Fewer than one rifle listing in ten went up, the lowest share of any type, and the rifle line touched 99.23 in mid-September before it came back a little. Revolvers were the busiest: more than a third of revolver listings changed price one way or the other.
Pistols barely moved. That fits what I see on the pistol cards on this site day to day: the popular carry guns sit at the same few price points for weeks, and when one drops, it’s a sale at one store, not a market move.
Model Watch: 26 Popular Guns
Here’s how the most popular guns moved, using the same model filters as our gun depreciation study. Average change is across every tracked listing of that model, so a single store’s sale doesn’t swing it. I only kept models with at least ten listings in the panel.
| Model | Listings | Average change | Price cut | Price raised |
|---|---|---|---|---|
| Ruger GP100 | 11 | +8.5% | 0.0% | 90.9% |
| Ruger SP101 | 10 | +8.2% | 10.0% | 70.0% |
| Beretta 92FS | 16 | +2.3% | 18.8% | 56.2% |
| Taurus G3C | 24 | +2.3% | 16.7% | 50.0% |
| Ruger 10/22 | 61 | +2.0% | 11.5% | 45.9% |
| Ruger Mini-14 | 19 | +1.8% | 15.8% | 47.4% |
| S&W M&P9 2.0 | 23 | +1.4% | 26.1% | 47.8% |
| S&W M&P9 Shield Plus | 30 | +0.6% | 23.3% | 10.0% |
| Benelli M2 | 44 | +0.6% | 6.8% | 20.5% |
| Beretta A300 Ultima | 28 | +0.4% | 3.6% | 10.7% |
| Tikka T3x | 51 | +0.3% | 2.0% | 5.9% |
| SIG Sauer P365 | 42 | +0.2% | 19.0% | 14.3% |
| Glock 43X | 37 | +0.1% | 13.5% | 21.6% |
| Walther PDP | 62 | +0.1% | 9.7% | 9.7% |
| Remington 700 | 88 | -0.2% | 4.5% | 2.3% |
| Winchester Model 70 | 59 | -0.2% | 27.1% | 20.3% |
| Savage Axis | 167 | -0.4% | 15.6% | 12.0% |
| HK VP9 | 28 | -0.5% | 17.9% | 17.9% |
| Ruger American Rifle | 23 | -0.7% | 13.0% | 4.3% |
| S&W M&P15 Sport | 21 | -0.7% | 23.8% | 23.8% |
| Mossberg 590 | 47 | -0.8% | 27.7% | 23.4% |
| Mossberg 500 | 61 | -0.9% | 37.7% | 19.7% |
| Colt Python | 92 | -1.0% | 35.9% | 16.3% |
| S&W M&P9 Shield | 25 | -1.4% | 24.0% | 12.0% |
| Ruger LCP Max | 33 | -1.6% | 24.2% | 27.3% |
| SIG Sauer P320 | 44 | -1.8% | 20.5% | 6.8% |
Two guns stand out. The Ruger GP100 went up an average of 8.5%, with 10 of its 11 listings raised and none cut. The SP101 followed at 8.2%. Those are small samples, so read them as a signal rather than a precise number, but nothing else on the list came close.
At the other end, the SIG P320 dropped 1.8% on average, and only 6.8% of its listings went up. The Colt Python and the Mossberg 500 both had more than a third of their listings cut. Our Colt Python value guide tracks what used ones sell for.
Gun Prices by Brand: Ruger Up, Colt and CZ Down
Brand by brand, the same picture holds: small averages, and a lot of churn underneath them.
| Brand | Listings | Average change | Price cut | Price raised |
|---|---|---|---|---|
| Ruger | 652 | +1.0% | 16.9% | 25.6% |
| Glock | 409 | +0.6% | 19.6% | 20.0% |
| Beretta | 626 | +0.1% | 4.2% | 6.2% |
| Winchester | 691 | 0.0% | 18.7% | 18.5% |
| SIG Sauer | 879 | -0.2% | 8.0% | 7.7% |
| Browning | 1,242 | -0.3% | 14.3% | 14.5% |
| Springfield Armory | 513 | -0.3% | 14.8% | 12.5% |
| Smith & Wesson | 1,067 | -0.7% | 18.5% | 10.9% |
| Henry | 670 | -1.1% | 26.1% | 10.6% |
| Mossberg | 844 | -1.2% | 30.9% | 9.1% |
| Taurus | 664 | -1.2% | 29.5% | 17.8% |
| Savage Arms | 1,166 | -1.5% | 21.7% | 7.4% |
| Colt | 558 | -1.6% | 34.9% | 10.0% |
| CZ | 244 | -2.5% | 39.3% | 15.2% |
Ruger was the only brand in this table with clearly more listings raised than cut, and its revolvers did most of the lifting. CZ, Colt and Mossberg sat at the other end, with roughly a third or more of their listings cut. If you’ve been waiting on a CZ or a Mossberg pump, this quarter was kinder to you than it was to a Ruger revolver buyer.
SIG and Beretta barely touched their prices at all. Fewer than one listing in six changed either way. Those prices hardly move from week to week, wherever you shop.
Which Retailers Moved Their Prices
Retailers handled the quarter very differently, and if you shop around, this matters more than the index itself.
- Guns.com was the most active repricer among the big stores. Of its 9,678 listings, 34.6% went up and 23.4% came down, for an average of +0.5%.
- Palmetto State Armory cut 36.8% of its 5,206 listings and raised 17.5%, an average of -1.6%. It was the biggest discounter among the big stores.
- Sportsman’s Outdoor Superstore cut 45.3% of its 671 listings, averaging -2.3%, the steepest of anyone.
- Brownells cut just 1.4% of its 1,100 listings and raised 5.3%, an average of +0.2%.
- Sportsman’s Warehouse changed almost nothing: 3.7% cut and 2.7% raised across 3,832 listings.
The lesson is simple. A store that reprices often is a store worth checking often. A store that never moves is either already cheap or never will be, and the only way to know which is to compare. That’s what our guide to comparing gun prices walks through.
Cheap Guns vs Expensive Guns
| Price in July | Listings | Average change | Price cut | Price raised |
|---|---|---|---|---|
| Under $500 | 10,941 | -0.2% | 21.2% | 18.9% |
| $500 to $999 | 15,533 | -0.3% | 19.3% | 16.8% |
| $1,000 to $1,999 | 10,569 | -0.5% | 18.6% | 14.8% |
| $2,000 and up | 6,460 | -0.3% | 11.7% | 10.2% |
Budget guns get repriced the most, which makes sense: a $20 move on a $350 pistol is a headline deal, and stores fight over that shopper. Guns over $2,000 barely move, because the people who buy them don’t wait for a coupon. The $1,000 to $1,999 band slipped the most, by a hair. That’s where a lot of mid-priced rifles and shotguns live.
What the Industry Numbers Say
Our index measures what retailers ask. Two other sources back up what it found.
Makers’ prices are flat too. The Bureau of Labor Statistics producer price index for small arms, ordnance and ordnance accessories manufacturing read 107.088 in July, August and September 2026, all marked preliminary, against 107.663 a year earlier. That’s 0.53% lower than a year ago. When makers aren’t raising what they charge stores, stores have no reason to raise what they charge you.
Last year looked the same. American Rifleman’s write-up of the RetailBI Report, built from sales data shared by more than 300 retailers, found that “the average amount spent on a new rifle last year dropped by 2.1 percent”, while the “cost for a handgun nudged up 1.3 percent” and “prices paid for shotguns jumped up 2.1 percent”. Rifles were the weak spot in 2025, and they were the weak spot in our index this fall too.
Inflation kept going. The BLS consumer price index rose from 333.918 in July to 336.940 in September, a 0.91% climb. Gun prices held still while everything else crept up, so in real terms a new gun got about 1% cheaper in three months.
Why Gun Prices Are Flat
Prices go up when buyers outnumber guns, and that hasn’t been the case for a while. The same RetailBI data showed demand cooling year after year. In the first quarter of 2025, American Rifleman reported the report’s finding that “retail firearm sales continued to decline in Q1 2025, with total unit sales declining 9.6% year-over-year and revenue down 11.5%”. It added that “rifles remain the most challenged category, falling 12.3%”.
That lines up with what our index shows. Rifles had the weakest demand in the retail data and the weakest prices in ours. When a category sells slower, stores cut prices on it first, because a rifle sitting on the rack ties up money the store needs for something else.
Then there’s the supply side. Makers aren’t raising their prices, as the producer index shows, and a gun store can’t charge much more than the shop down the road or the website on your phone. Put slow demand, steady supply and easy price comparison together, and you get exactly what we measured: a market that barely moves on average, with constant small cuts and raises underneath.
None of that is permanent. An election, a ban proposal or a supply problem has pushed prices up fast before, and our index will show it the week it starts. For now, the buyer has the upper hand.
Are Gun Prices Going Up or Down?
Neither, and that’s the honest answer for fall 2026. New gun prices are flat in dollars and slipping a little in real terms. There’s no sign of the panic pricing people remember from 2020, and no sign of a collapse either.
What there is, under the flat average, is constant churn. More than a third of listings changed price at least once between the first week and the last, and the cuts slightly outnumbered the increases. For a buyer, that churn is the opportunity. The average gun didn’t get cheaper, but a lot of individual guns did, at individual stores, for a week or two at a time.
The next big test is Black Friday, which our Black Friday gun deals page tracks as it happens.
What This Means If You’re Buying
- Don’t wait for a market drop. The market isn’t dropping. If the gun you want is at a fair price today, waiting a season saves you next to nothing on average.
- Shop the stores, not the calendar. The standard Glock 19 Gen 6 listed from $597.60 to $634.99 across the stores we track this week, a 6% spread on the same pistol. The index moved 0.33% all quarter.
- If it’s a Ruger revolver, buy it sooner. That’s the one corner of the market where prices went the wrong way.
- If it’s a SIG P320, a Mossberg pump or a CZ, watch for cuts. Those are the ones stores were marking down.
Here’s where the two most popular pistols in the country are priced right now, at the retailers we trust most:
The current Glock 19, new
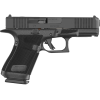
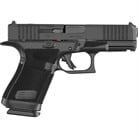
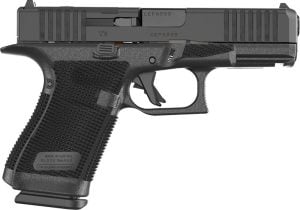
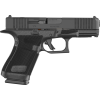
Average listing up 0.2% this quarter
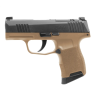
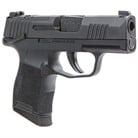
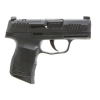
If you’d rather buy used, our used vs new guns breakdown covers when that’s worth it. And for what’s happening to the cost of feeding them, see our ammo price index.
How the Gun Price Index Works
The index uses the daily price snapshots in our price catalog. Each listing is one gun at one retailer, tracked by the retailer’s own product code, so a price change means the store changed its price, not that a different gun showed up. I took each listing’s median price for every week from July 25 to October 22, 2026, kept only new guns priced in both the first and last week, and set the first week to 100. Each week’s reading is the geometric average of every listing’s price against its own first week.
Three things keep it honest. Used guns are left out. Any listing whose price doubled or halved is dropped as a catalog error. And any retailer with 1,000 or more listings where under 0.5% changed price in the whole quarter is excluded as a frozen feed, because a store that never updates its prices would drag the index toward flat. One retailer met that test, with 12,978 listings that didn’t change once. These are asking prices, not what buyers paid after coupons and rebates.
FAQ: Gun Prices in 2026
Are gun prices going down in 2026?
Barely. Our US Gun Price Index followed 43,503 new-gun listings at the same retailers from July 25 to October 22, 2026, and it ended at 99.67, down 0.33%. Consumer prices rose 0.91% over a similar stretch, so in real terms new guns got about 1% cheaper.
Are gun prices going up?
Not on average. 15.9% of listings went up this fall, but 18.5% came down and 65.6% never changed. The clear exception was Ruger revolvers: the GP100 rose an average of 8.5% and the SP101 8.2%.
Which guns dropped in price the most?
Among popular models, the SIG P320 fell an average of 1.8%, the Ruger LCP Max 1.6% and the S&W M&P9 Shield 1.4%. By brand, CZ cut prices on 39.3% of its listings and Colt on 34.9%. By type, rifles slipped the most, ending at 99.35.
What is a gun price index?
It tracks what the same guns cost over time. Ours follows the same new gun at the same retailer every week and sets the first week to 100, so a reading of 99.67 means those guns cost 0.33% less than when the quarter started. Used guns and catalog errors are left out.
Is now a good time to buy a gun?
Yes, if you find a fair price. The market isn't falling, so waiting saves little on average, but prices churn at individual stores. The same Glock 19 Gen 6 listed from $597.60 to $634.99 across the stores we track, a far bigger gap than anything the index did all quarter.
Are gun prices still higher than before 2020?
Our index starts in July 2026, so it can't answer that directly. What it shows is that prices today are stable, and the government's producer price index for small arms, ordnance and accessories manufacturing was 0.53% lower in September 2026 than a year earlier.
Which retailers cut gun prices the most?
Among the big stores, Palmetto State Armory cut 36.8% of its listings for an average of -1.6%. Guns.com changed prices most often, raising 34.6% of listings and cutting 23.4%. Brownells and Sportsman's Warehouse barely moved.
4,798+ Gun & Ammo Deals
Updated daily from 200+ top retailers. Filter by category, caliber, action type, and price.
Related Guides